I wanted to put my absorption spectrometer to the test. I designed an experiment to investigate how the time that Chinese Kale is left in the freezer impact the concentration of chloropyll in its leaves.
Aim and Theory
Investigation Objective and Hypothesis
The primary goal of this experiment is to investigate how the duration of cryogenic storage (time spent in a freezer) impacts the total chlorophyll concentration in kale leaves. It is hypothesized that as the freezing time increases, the overall concentration of active chlorophyll will decrease.
Spectroscopic Theory and Wavelength Absorption
To measure this breakdown process, we must look at how chlorophyll interacts with electromagnetic radiation. According to quantum mechanics, molecules absorb photons whose energy (E = hf) corresponds exactly to the difference between their discrete electronic energy levels. Chlorophyll a and b absorb light strongly in the blue region (430nm - 450nm) and the red region (640nm - 660nm) while reflecting green wavelengths. An initial control experiment was successfully set up and conducted using the absorption spectrometer to pass light through a fresh sample, mapping out these precise baseline absorption bands to use as a reference profile.
Methodology for Chlorophyll Extraction
The experiment requires preparing multiple identical batches of kale and leaving them in the freezer for distinct intervals, such as zero days for a baseline control, two days, four days, and six days. After the designated freezing period, the chlorophyll is extracted by grinding a fixed mass of the kale leaves and dissolving the pigments into a constant volume of solvent, such as ethanol or acetone, resulting in a clear liquid solution ready for optical testing.
Quantifying Concentration via Spectral Intensity
To calculate the change in concentration, each liquid sample is placed between the halogen light source and the diffraction grating of the spectrometer. The transmitted light projects a spectrum, which is captured digitally rather than evaluated by eye. By analyzing the pixel brightness and intensity of the specific blue and red absorption bands identified in the initial test, the precise amount of light passing through the sample can be measured.
Applying the Beer-Lambert Law
The final analysis relies on the Beer-Lambert Law, which states that the absorbance of light is directly proportional to the concentration of the absorbing chemical species in the solution. Fresh kale samples with a high chlorophyll concentration will absorb a large number of photons, causing the corresponding color bands in the spectrum to look dark and show low pixel intensity. Conversely, degraded kale samples with a low chlorophyll concentration will allow more light to pass through, resulting in significantly brighter pixels in those color bands, allowing a direct mathematical model of degradation over time to be plotted.

Chlorophyll Extraction Process
Preparation of the Plant Tissue
To ensure the accuracy of the spectral baseline, the Chinese kale leaves were first thoroughly washed with distilled water to remove any surface contaminants or debris. Once dried, the leaves were meticulously sectioned and cut into small pieces using a clean blade. This mechanical cutting process increases the total surface area of the plant tissue, making the subsequent chemical extraction phase significantly more efficient.
Mechanical Lysis and Cell Disruption
Following the initial sectioning, the fragmented kale pieces were placed into a container and crushed manually. This physical grinding action serves to break down the rigid cellulose-based cell walls of the kale, initiating the release of the intracellular contents. Disrupting these outer walls is a necessary step to directly expose the internal chloroplast membranes to the liquid solvent.
Solvent Addition and Pigment Dissolution
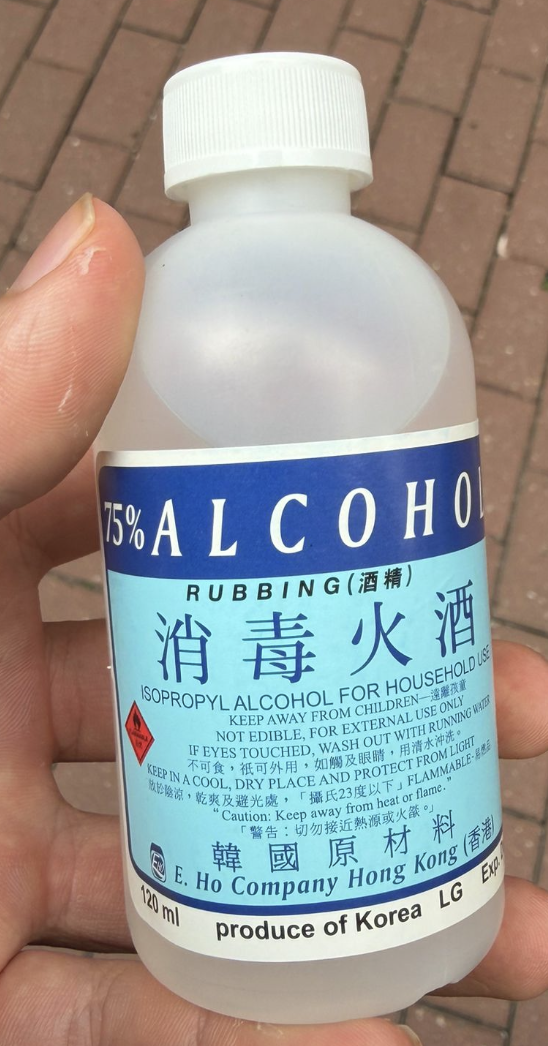
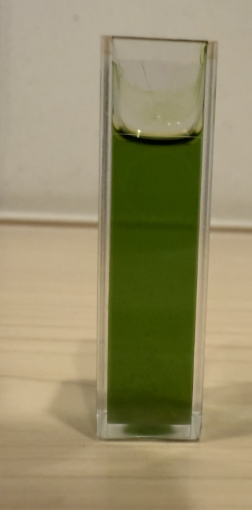
Once the tissue was thoroughly crushed, 75% isopropyl alcohol (rubbing alcohol) was introduced to the mixture as the primary extraction solvent. Because chlorophyll is a non-polar molecule, it is highly soluble in alcohols but poorly soluble in water. The isopropyl alcohol molecules easily penetrate the disrupted cell membranes, dissolving the chlorophyll a, chlorophyll b, and carotenoid pigments out of the plant matter and into the liquid phase, forming a dark green solution.
Filtration and Isolation of the Liquid Extract
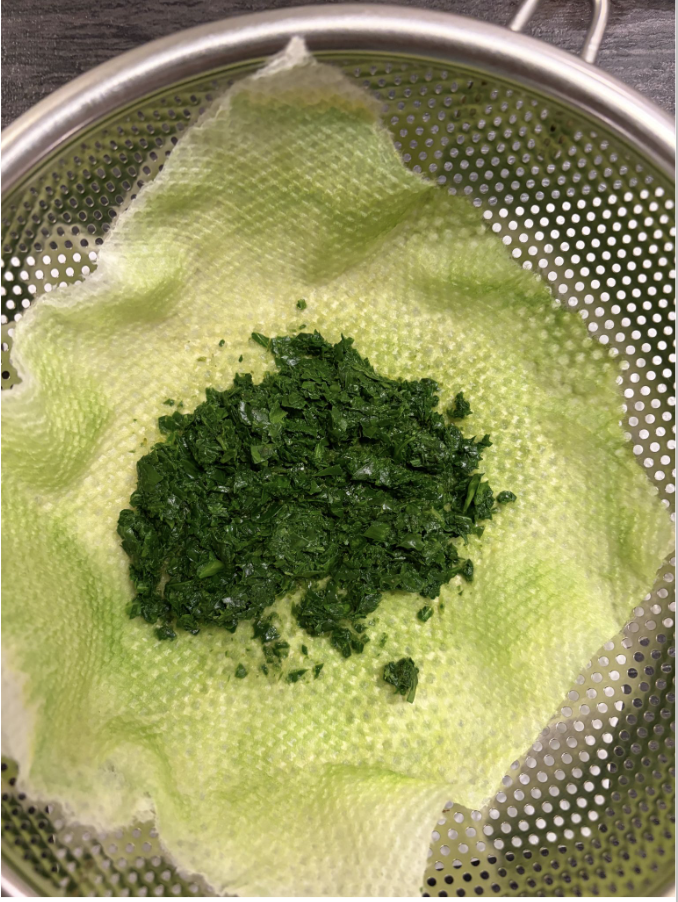
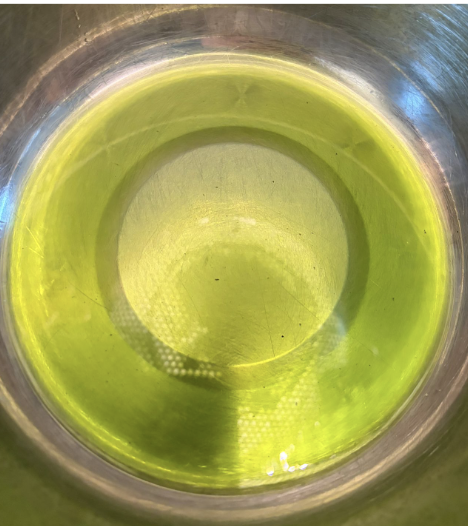
The final step involved isolating the pure liquid extract from the remaining solid plant debris through a two-stage filtration process. The mixture was first passed through a fine metal sieve to catch the large fragments of compressed leaf tissue. The remaining liquid was then run through a kitchen paper towel filter, which acted as a fine semi-permeable membrane to trap microscopic cellular waste. The resulting clear, deep green filtrate was successfully isolated and transferred to a clean container, ready for optical analysis in the spectrometer.
Python Code
Program Objective and Overview
The purpose of this Python script is to quantitatively evaluate how the Chinese kale extract alters the light spectrum compared to an open-air control. Rather than relying on subjective visual observations of the spectrum images, this program converts the visual data into numerical values. It loads two photographs—the spectrum passing through air (NoSample.jpeg) and the spectrum passing through the kale extract (WithSampleChineseKale.jpeg). By breaking down the image arrays, averaging pixel rows to reduce camera sensor noise, and plotting the isolated Red, Green, and Blue channel intensities across the horizontal X-axis, the program creates an objective, data-driven graph mapping exactly where and how much light was absorbed.
Library Imports and File Path Setup
The script begins by importing three essential data analysis libraries: PIL.Image to load and open the digital photographs, matplotlib.pyplot to generate and customize the final intensity graph, and numpy to handle the pixel matrices and complex mathematical averages efficiently. Following these imports, the variable fPath is defined to store the string path of the directory containing the cropped spectrum images, allowing the script to seamlessly locate and fetch the data files during execution.
Defining the Spectral Analysis Function
A custom function named getSpectrum(fname) is defined to automate the data extraction process for any given spectrum photograph. The function begins with img = Image.open(fname), which uses the PIL library to open the file. Next, imgArr = np.array(img) converts the image object into a three-dimensional NumPy array, where every single pixel is represented by its specific coordinate location and an array of three numerical values corresponding to its Red, Green, and Blue channels. The script then calls xMax, yMax = img.size to automatically capture the width and height dimensions of the photograph in pixels.
Noise Reduction via Spatial Averaging
To ensure that random camera noise or slight dust particles on the lens do not skew the scientific results, the code isolates and averages the data across the image. The variables row_start and row_end define the vertical boundaries of the spectral band, and band = imgArr[row_start:row_end, :, :] slices the image matrix to keep only the pixels located inside this region. The critical line avg = band.mean(axis=0) calculates the mathematical mean of the pixel values vertically within that band. This collapses the two-dimensional image area into a single, clean horizontal row of clean, averaged color values, smoothing out background variations.
Channel Isolation and Maximum Intensity Tracking
Once the smoothed row array avg is generated, the script splits it into individual color channels for independent analysis. The syntax r = avg[:, 0], g = avg[:, 1], and b = avg[:, 2] extracts the pure Red, Green, and Blue color values respectively across every horizontal position along the X-axis. Additionally, the line intensity = np.max(avg, axis=1) tracks the maximum color value at each horizontal pixel coordinate. Finally, return r, g, b, intensity sends these four extracted data arrays back to the main program loop, completing the processing cycle for that specific image.
Executing Data Extraction and Plotting the Results
With the analysis function fully established, the main body of the program runs the function on both experimental groups using the commands getSpectrum(fPath + 'NoSample.jpeg') and getSpectrum(fPath + 'WithSampleChineseKale.jpeg'). This returns separate RGB arrays for both the open-air control and the kale sample. The script initializes a graph using fig, ax = plt.subplots() and utilizes multiple ax.plot() commands to map out the individual Red, Green, and Blue line arrays for both data sets. The open-air control data is represented with solid lines, while the kale data uses distinct dashed lines to make comparison straightforward.
Graph Customization and Visualization
The final lines of the code focus on formatting the output data into a presentation-ready scientific figure. The functions ax.set_xlabel('pixels x') and ax.set_ylabel('intensity') label the axis boundaries, assigning the horizontal axis to spatial pixel coordinates and the vertical axis to raw color intensity values ranging from 0 to 250. The command ax.legend() automatically generates a color-coded key on the screen to help the viewer distinguish between the Air control and the Kale sample trends. Lastly, plt.show() renders the fully generated interactive plot window on screen, revealing the clear drop in blue and red channel intensities caused by the chlorophyll's absorption bands.
